

Advanced Currency Strength
Best Solution for any Newbie or Expert Trader!
This Indicator stands out as an exceptional, cost-effective trading tool thanks to its integration of unique proprietary features and a novel formula. From just ONE chart, you can gauge the Currency Strength across 28 Forex pairs! Consider how this capability can enhance your trading by allowing you to precisely identify the initiation point for new trends or scalping opportunities.
The Special Indicator is designed to significantly enhance your trading by providing visual cues and alerts directly on your charts. Here's how it can transform your approach:
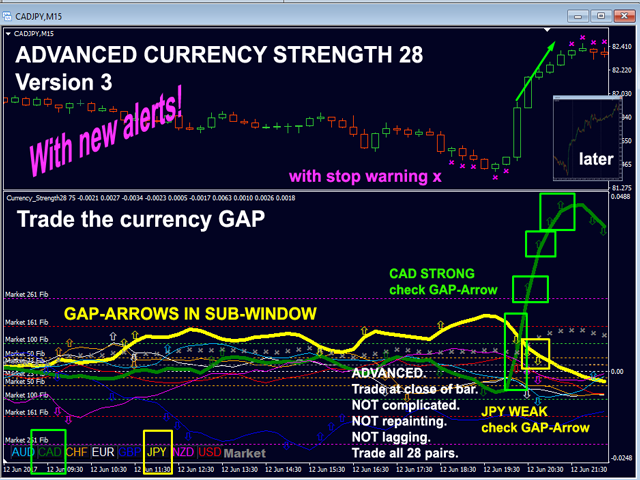
- Dynamic Currency Momentum Indicators: Arrows in a sub-window indicate significant momentum gaps in currency strength, guiding your trading decisions.
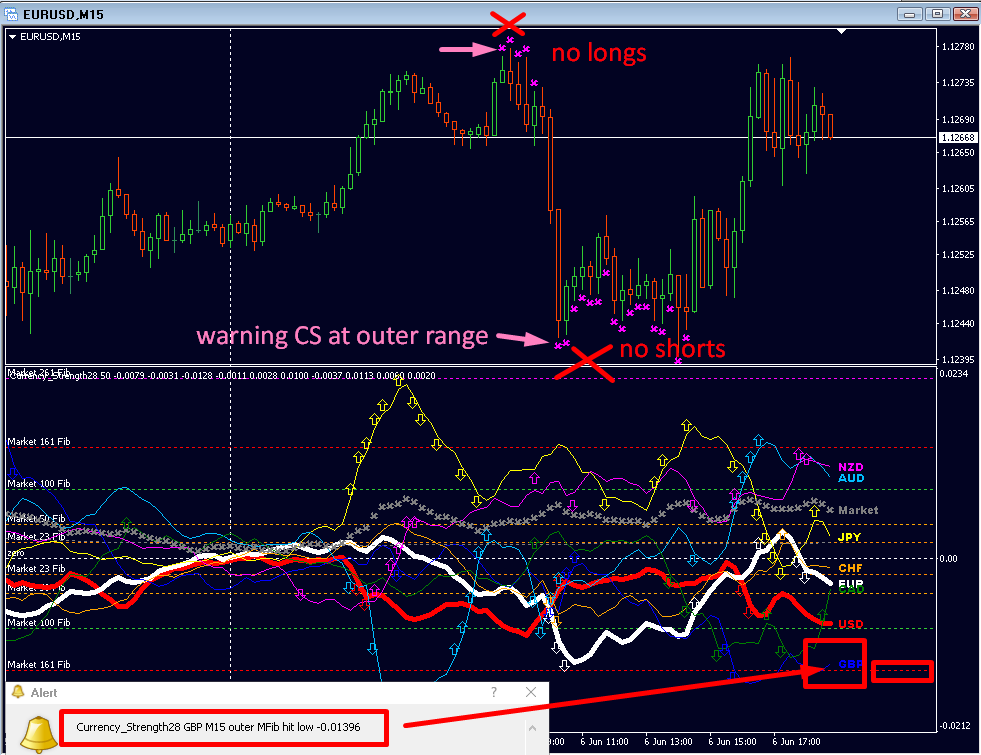
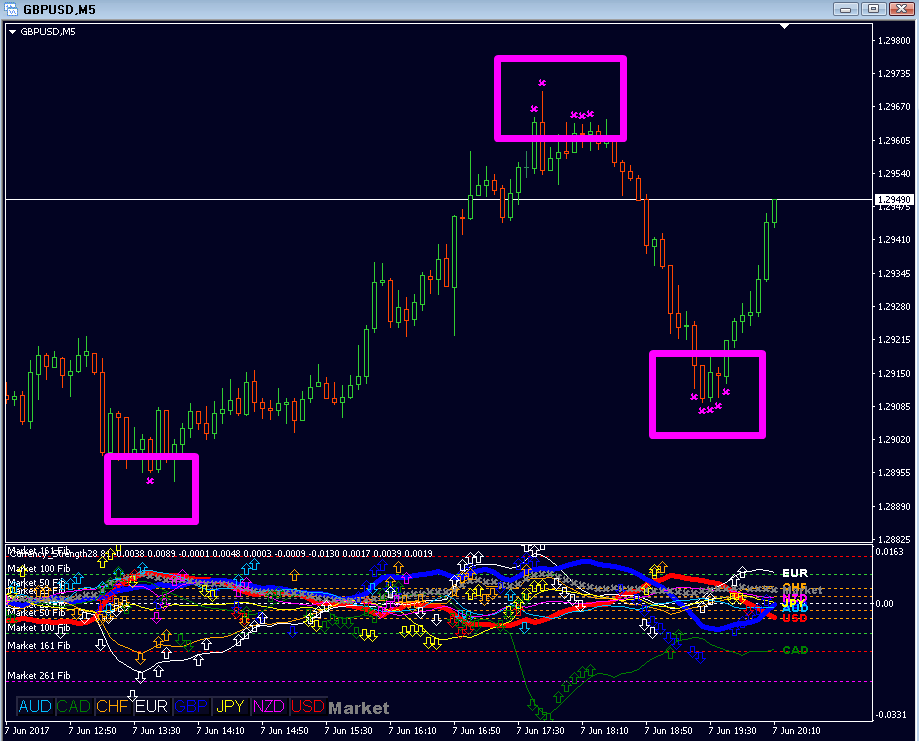
- Critical Market Condition Alerts: Warning signs appear on the main chart window when a currency reaches oversold or overbought states, based on external market Fibonacci levels.
- Reversal Alerts: Receive alerts for potential pullbacks or reversals when the currency strength recedes from the outer range.
- Cross Pattern Alerts: Special notifications for identifiable cross patterns, aiding in decision-making.
- Multi-Timeframe Visibility: Easily discern the overall trend with options to view across multiple timeframes. The currency strength lines are exceptionally smooth, allowing for precise entries by utilizing higher timeframes to gauge trends and lower ones for entry points.
- Innovative Algorithms: Built on advanced algorithms, this tool simplifies the identification and confirmation of potential trades by graphically displaying changes in currency strength and past performance.
- Comprehensive Currency Analysis: Advanced Currency Strength28 Indicator is applicable to all 28 currency pairs. It introduces unique features like Market Momentum and dynamic Market Fibonacci Levels that adjust to real-time market conditions, providing a substantial trading edge. The inclusion of a 9th line for Market Momentum is a novel feature in Forex trading.
- Historical Data Visualization: All graphics are based on new buffers that represent historical dynamic Market Fibonacci levels, providing a deeper insight into market dynamics.
This tool is equipped to guide you through various trading scenarios, whether you're aligning with the trend, anticipating a continuation, or spotting a pullback. Its robust framework and intuitive alerts are designed to optimize your trading strategy effectively.


Here’s a simplified breakdown of the Indicator's parameters to enhance your understanding and customization options:
Currency Strength Timeframe Settings
- Use Higher TF: Incorporates data from a higher timeframe to increase accuracy. Option to add the indicator twice on one chart for layered analysis.
Chart Settings
- Use Currency Specific Characteristics: Tailors processing for individual currency traits.
- Draw GAP: Displays arrows in the sub-window to highlight strong currency momentum gaps.
- GAP Market Fib (23) Slope: Determines the angle for arrows based on currency momentum.
- Draw Outer MFib Stop: Issues pullback/reversal alerts when currency strength retracts from the outer range. Recommended to set at 161 or higher for M1.
- Outer MFib Stop (100-161): Displays warning signs on the chart when currencies hit oversold/overbought levels, using outer market Fibonacci levels.
Quick Chart Access
- Quick Chart Open in New Window: Allows for quick switching between currency pairs by clicking their names. Set to true to open pairs in new windows.
Alert Settings
- Alert Outer MFib Trigger HIT: Notifies when currency strength touches the designated outer Market Fib levels.
- Alert Outer MFib Trigger HOOK: Alerts for potential pullbacks or reversals when strength dips from the outer range.
- Outer MFib Trigger Level (161): Sets the Fibonacci level for triggering alerts.
- Minimum Hook GAP (28): Specifies the minimum inside GAP slope value required for an alert.
Cross Market Alerts
- Cross Market Fib Slope: Configures alerts based on the slope of market Fibonacci levels.
- Use 4 Bars Cross Pattern: Allows selecting between a 3-bar or 4-bar pattern for cross alerts.
- Alert Currency Cross: Activates alerts when there is a currency cross.
- Show Triangle on Subwindow: Displays a visual triangle marker for currency crosses.
- Show Vertical Line for Chart Symbol: Places a vertical line on the chart corresponding to significant events or alerts.
These settings provide extensive customization to tailor the indicator to your specific trading needs and preferences, enhancing both the analytical depth and operational flexibility.
Advanced Currency Strength - USER MANUAL
This indicator distinguishes itself from conventional currency strength indicators by introducing an innovative formula that calculates currency strength, incorporating unique features such as Market Momentum and dynamic Market Fibonacci Levels which adjust in real-time to market activity. Market momentum, represented as the 9th line, indicates whether the market is active or passive.
Key features include:
Smooth Currency Strength Lines: These lines are exceptionally smooth across all timeframes, ideal for identifying general trends in higher timeframes and fine-tuning entry points in shorter ones.
Dynamic Market Fibonacci Levels: The only indicators that use advanced dynamic Market Fibonacci levels, our proprietary code, to adapt to both current and historical market activities.
Optimized for Each Timeframe: Every timeframe is independently optimized to ensure accuracy and efficiency.
Multi-Time-Frame Settings: Allows for seamless integration across multiple timeframes for comprehensive analysis.
Currency-Specific Handling: Each currency is analyzed based on its unique characteristics, enhancing the precision of the analysis.
Visual Alerts and Indicators:
- Arrows in Sub-Window: Show strong currency momentum gaps.
- Warning Signs: Appear on the main window for currencies in the oversold/overbought zones using outer market Fibonacci levels.
- Hit and Pullback/Reversal Alerts: Trigger when currency strength recedes from the outer range.
- Special Cross Pattern Alert: Notifies of specific cross patterns in market movement.
Enhanced Performance: Features such as reduced data calls from external pairs and automated support charts accelerate the broker feed.
Quick Change Chart Buttons: Facilitate swift transitions between charts.
Once added to a single chart, this indicator not only provides real-time signals for all 28 forex pairs but also displays historical signals and momentum on the actual chart. This allows traders to have a historical perspective and customize settings to align with their specific trading style and timeframe. This is why many traders regard it as the best currency strength indicator available.
The arrow in the sub-window is a visual cue indicating when a currency line has reached a necessary minimum angle or slope. In the illustrated example, the value 23 marks the distance between the zero line and the 23 Market Fibonacci level, ensuring that chart zoom does not influence the results. This value can be adjusted as needed.
New Version Features:
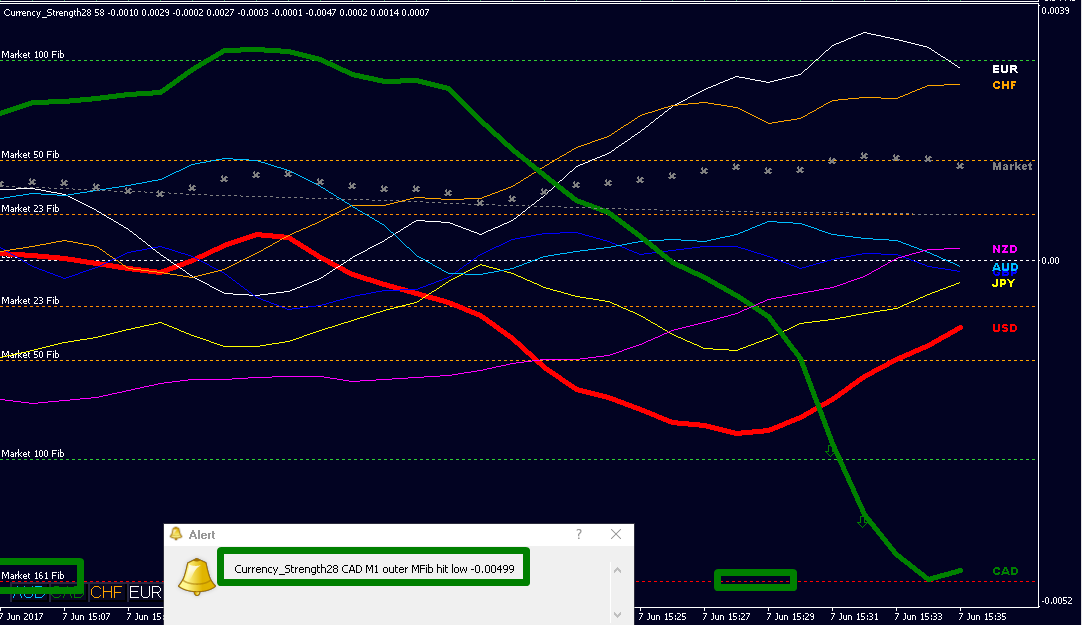
- Outer Market Fibonacci Hit (Input 161) Warning Alert: This feature alerts when the currency strength line, such as the Canadian Dollar (CAD), hits the lower Market Fibonacci level of -161, indicating significant market movements.
Strategic Trade Management: Pay close attention if you are currently in a trade. This tool advises whether to take profits or adjust your stop loss to secure gains based on the current price's proximity to key support/resistance (S/R) levels and supply/demand zones. If the price is near these critical points and the CAD's strength is waning, there's a high likelihood of a price pullback due to exhausted currency strength. This information is crucial for making informed decisions to optimize trade outcomes.
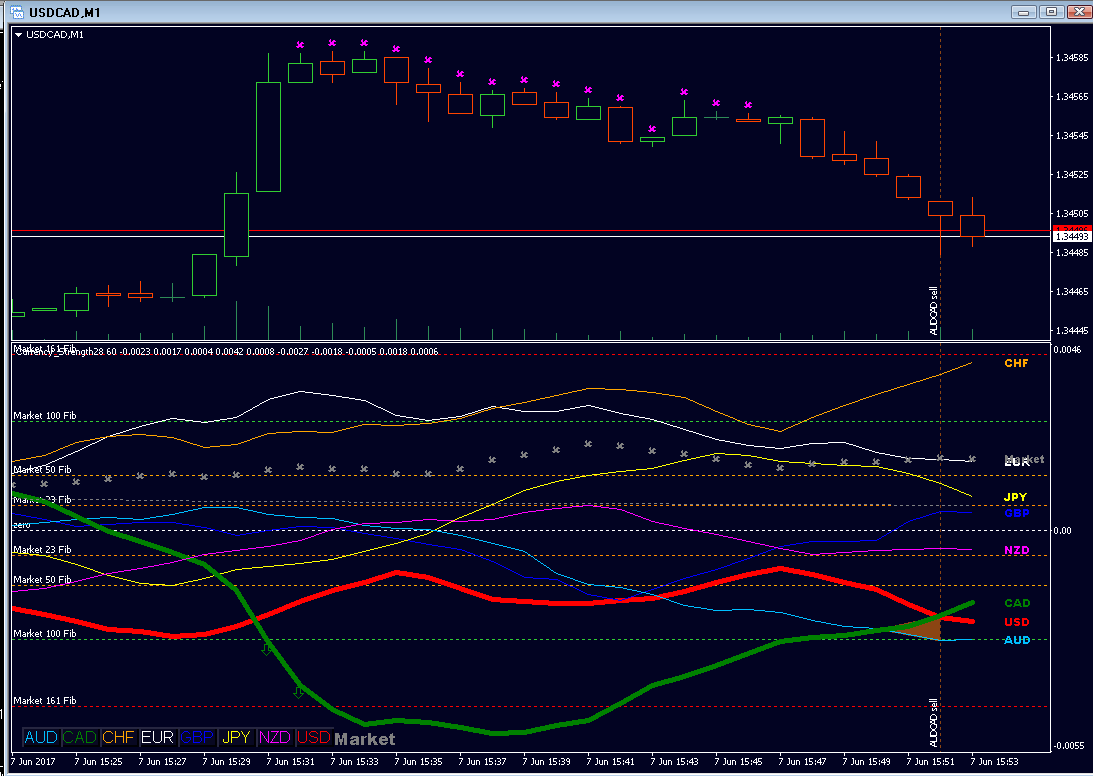
In the updated scenario on the same chart, following an alert where the Canadian Dollar (CAD) hit the outer market Fibonacci level, we now observe the green currency strength line for CAD retracting from the lower outer range back into the inner zone. A purple stopper sign appears above the candles, indicating this shift.
This movement signifies that the previously observed weakness in CAD is diminishing, and it is gaining strength. Given that the current chart is for USDCAD, where CAD is the quote currency, this strengthening of the CAD requires an inversion in our trading approach. Therefore, a stronger CAD suggests that it is time to consider selling USDCAD, as the increasing strength of the CAD relative to the USD points to potential downward movement in the USDCAD pair.
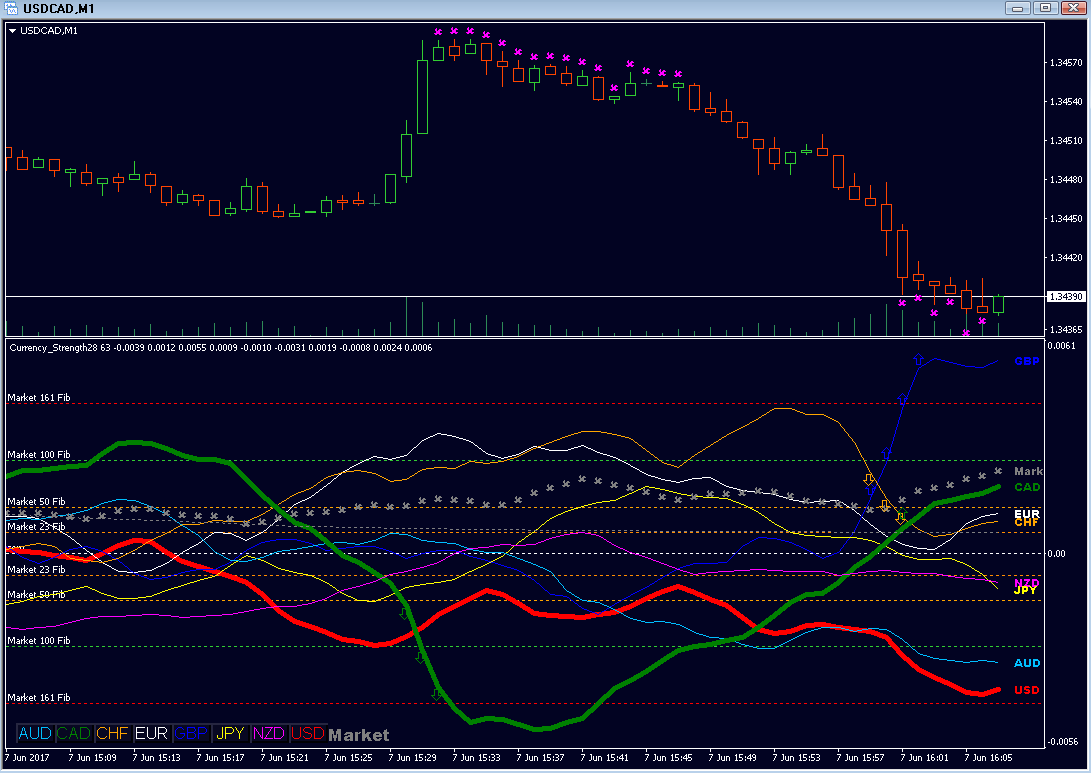
As time progresses further on the chart:
The green currency strength line representing the Canadian Dollar (CAD) continues to ascend, now crossing the white zero line. This suggests that CAD may continue to strengthen. Concurrently, the base currency, the US Dollar (USD), has reached the Market Fibonacci level of -161. This significant event once again calls for close attention to the USDCAD pair.
If you previously sold USDCAD following the earlier indications, this would be an opportune moment to consider your next steps—whether to take profits or to adjust your stop loss to lock in gains. This decision should be guided by the continued monitoring of both currency strengths and market conditions. As the dynamic between USD and CAD evolves, it sets the stage for new decisions and actions, effectively restarting the cycle of strategic trading based on these insightful indicators.
The functionality of the indicator includes key visual alerts to enhance trading decisions:
Arrow Display in Sub-window: An arrow appears in the sub-window when a minimum GAP between the currency lines is reached. This GAP is significant and indicates a strong momentum or shift in currency strength. The specific value for this GAP is editable, allowing traders to set a threshold that best suits their trading strategy.
Warning Sign in Main Window: A warning sign is displayed on the main chart window when either the base or the quote currency reaches the outer Market Fibonacci levels. This alert is crucial as it signals extreme conditions—either oversold or overbought states—potentially prompting a market reversal or pullback. Like the GAP value, the threshold for triggering this warning is also an editable input, enabling customization to accommodate different risk tolerances and market approaches.
These features are designed to provide immediate visual cues to traders, helping them make timely and informed decisions based on predefined conditions and thresholds that align with their trading methodologies.
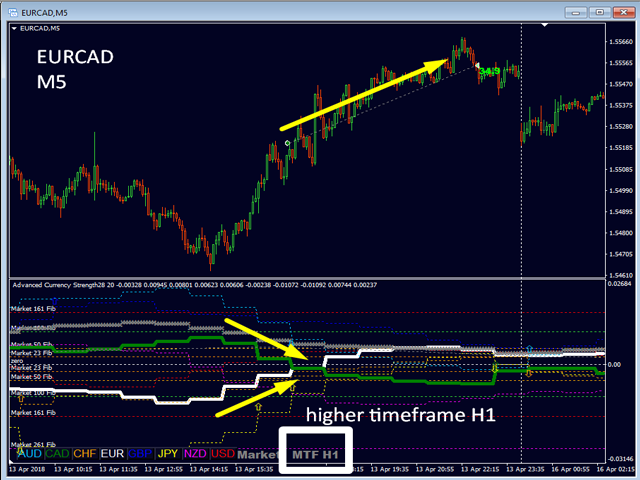
Trading by incorporating a higher timeframe analysis into a lower timeframe chart can provide deeper insights and improve decision-making in forex trading. When using the Advanced Currency Strength28 Indicator, which can display data from a higher timeframe (like H1) on a lower timeframe chart (like M5), you can effectively enhance your trading strategy. Here’s how to do it:
Understanding the Setup
Indicator Configuration: Set the indicator to display the currency strength from a higher timeframe (H1) on your lower timeframe chart (M5). This setting allows you to observe the broader market trends while trading on a shorter scale.
Reading the Currency Lines: The indicator will show the currency strength lines as they are updated at the close of each candle in the higher timeframe. This means that every hour (as per the H1 setting), the strength line will update to reflect the closing value of that period.
Trading Steps
Identify Trend Direction: Look for the general trend direction in the H1 currency strength lines. A rising line suggests strengthening, while a declining line indicates weakening.
Wait for Candle Close on Higher Timeframe: Monitor the points where the higher timeframe (H1) candle closes, as these will be represented by steps or shifts in the currency line on your M5 chart. These points are critical as they reflect a summarized view of market sentiment and strength over the past hour.
Make Entry Decisions: Use the closure points of the H1 candles as potential entry signals on your M5 chart. For example, if the H1 line shows a strengthening trend and you observe a bullish pattern on the M5 chart at the time of the H1 close, it might be a good entry point for a long position.
Combine with Other Indicators: For better accuracy, combine the insights from the currency strength lines with other technical indicators such as Moving Averages, MACD, or RSI. This combination can help confirm trends and signal potential reversals.
Set Stop-Loss and Take-Profit: Always set stop-loss and take-profit levels based on the volatility and the levels observed in the higher timeframe. This approach helps manage risk while allowing room for profits.
Monitor and Adjust: As the market moves, continue to monitor the H1 updates and adjust your positions accordingly. Look for signs of reversal or continuation in the currency strength line and be ready to close or modify your trades.
By effectively leveraging the higher timeframe data on your lower timeframe chart, you can capitalize on the broader market movements while maintaining the agility to trade at a smaller scale. This strategy helps align your trades with the overall market trend, potentially increasing the probability of success.
Dynamic Market Fibonacci levels (MFib) are a sophisticated feature unique to the Advanced Currency Strength28 indicator, which you won't find in standard currency meters. Here’s a deeper dive into what they entail and how they are used in trading:
Overview of Dynamic Market Fibonacci Levels
Dynamic Market Fibonacci levels are an innovative adaptation of traditional Fibonacci tools. Unlike traditional usage that applies Fibonacci levels directly to price charts, Dynamic Market Fibonacci levels are applied to currency strength across the entire market, encompassing all 28 forex pairs. This approach offers a broader view of market dynamics and is particularly insightful for identifying activity from market makers.
Key Features and Applications
Market-Wide Analysis: These levels are calculated based on the collective activity of all 28 pairs, providing a macroscopic view of market behavior.
Identification of Market Makers’ Activity: Dynamic MFib levels help pinpoint times when market makers are most active, such as the surge in market activity at the London open or the decline around the London/New York close.
Market Fibonacci Retracement Zones: The levels at MFib 161/-161 and MFib 261/-261 are specifically identified as Market Fibonacci Retracement Zones. These are critical zones where potential reversals or significant strength changes might occur, aiding traders in spotting key trading opportunities.
Entry Timing: The MFib 100/-100 level is used to assess whether traders are entering a trade early enough, optimizing entry points in relation to market strength.
Sentiment Check: Some traders also utilize the MFib 23/-23 level to gauge if the overall market sentiment aligns with their trade (though this is optional).
Visualization and Alerts:
- GAP Value: The MFib23 value is used to determine the GAP value, which is visualized by an arrow in the indicator.
- HIT and HOOK Alerts: These functions are designed to alert traders to significant market movements, indicating when currency strength reaches or pulls back from critical MFib levels.
- Pink Stopper Sign: This visual element serves as a warning for when currency strength reaches extreme levels, providing a cautionary signal to traders.
Significance in Trading
By applying these dynamic levels to currency strength, traders can more effectively align with the market's broader movements and capitalize on shifts influenced by major players. The Advanced Currency Strength28 indicator's unique application of Market Fibonacci levels offers traders a powerful tool to enhance their strategic decision-making process, moving beyond simple price analysis to a more integrated view of market forces.
Subscribe
and get a lot of interesting things!