

Every day your capital will increase!
Forex Divergence Trading indicator


How does the divergence indicator work?

Trading on divergences is one of the most profitable strategies in the world!
Just put the Divergence Trading indicator on the quote chart. You will receive the best trading signals!
Automatic market analysis
Automatically analyze the quotation chart of any asset and find divergences and convergences on it. This can be a long-term or short-term trade.
Creates a better trading strategy
Our Forex divergence tool independently create a trading strategy for each individual asset with maximum profitable results and give the trader trading signals in accordance with this strategy.

Calculate statistics of trading signals
The divergence indicator shows in advance the mathematical statistics of the strategy it has created for trading on divergence. This way, you can predict your future results even before you start trading.
Trading signals with maximum profit
Of course - it's convenient and simple. You can receive divergence trading signals even on your smartphone, know exactly when to open and close trades to get the maximum profit!
How much profit can you make?
We independently tested our divergence trading indicator. With the help of the signals of this Forex tool, we have been trading for 3 months and we earned about $61 701!!! Most importantly, this divergence indicator is very easy to use, and everyone can repeat our trading results!


Divergence Trading Indicator
- Divergence trading indicator for MT4 platform
- Divergence trading indicator for MT5 platform
- Divergence Utility for automatic order management (for MT4 and MT5)
- Set-files for automatic configuration
- Unlimited license (for any number of accounts that belong to you)
- Detailed instructions – how to install and use
Forex Divergence Indicator
Technical parameters of the
divergence mt5/mt4 indicator :
- Trading strategy: identifying and scalping market divergences
- Timeframe for trading: Any

- Trading time: Any
- Potential profitability: 30-100% per month
Description of the DIVERGENCE TRADING system:
New strategy for every asset
This divergence indicator uses a divergence/convergence trading strategy. It independently analyzes the market and identifies them on the charts of quotations of various assets.
Powerful profit machine
The indicator independently creates a divergence/convergence trading strategy by choosing the best parameters from over 100,000 possible options.
Push and Pop-Up signals
Our indicator shows arrow signals, pop-up signals, PUSH notifications and even sends trading signals to your email. You can trade using our indicator even through the mobile platform on your smartphone!
Accuracy over 95%
The accuracy of the signals of our divergence trading strategy is more than 95%. You can get about 30% profit every month and double the size of your trading account in a few months!
The accuracy of the divergence indicator signals is more than 95%!
So, on this page you can buy an divergence mt5 indicator with artificial intelligence that detects divergences and convergences on the quotation chart and creates a trading strategy whose goal is to make a profit on the repayment of divergences and convergences. You could read the description of how the divergence indicator works (the author’s name DIVERGENCE KILLER) above. Here we will describe in detail what divergence /convergence is, how it occurs, how it is revealed, how the divergence is repaid, and most importantly, how to make a profit on all this. So, let’s get started!

The best divergence indicator
As for the best divergence mt5 indicator, traders all over the world often use an indicator such as MACD to identify divergences/convergences. Yes – this is a classic indicator that is included in the standard package of any trading platform or service for technical analysis of the market. Our team also followed the path of using a classic tool for market analysis and created an indicator with artificial intelligence DIVERGENCE KILLER, which works on the basis of the classic MACD indicator, the the abbreviation means – Moving Average Convergence Divergence.
However, as you understand, we have done a good job to ensure that this classic indicator begins to bring huge profits. What have we done:
- We have added artificial intelligence to this technical divergence indicator, which is able to independently anasize the quotation chart, find divergences/convergences and visually show their location (beginning and ending.
- We have made the artificial intelligence of the divergence indicator work for the benefit of the trader, namely, to create a trading strategy, the purpose of which is to make a profit on all emerging divergences and convergences.
- Our divergence indicator is able to calculate profit and loss and create a strategy so that the profit is much greater than the loss. In order to create a trading strategy, DIVERGENCE KILLER compares thousands of different trading strategies and selects the one that gives the greatest amount of profit.
- As we wrote above, our indicator shows everything visually, and also gives trading signals – so using our divergence indicator is very convenient and, of course, very profitable! However, enough advertising. Let’s return to our topic – what is divergence, how it works and how to get profit with the help of the revealed divergence.
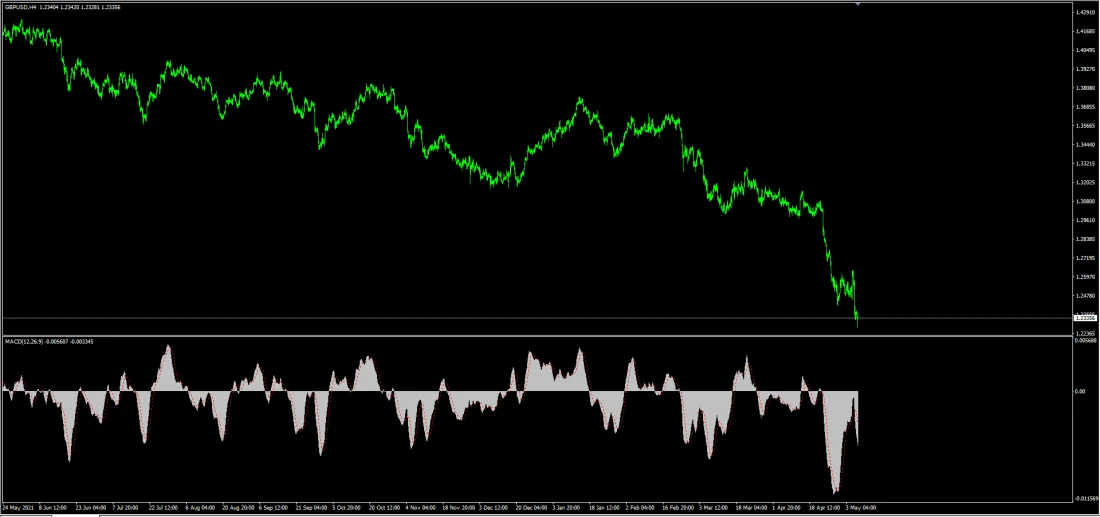
This is how the quotation chart looks with the usual (classic) MACD indicator. As you can see, nothing is clear (where divergences begin and end and how to make money on divergences?)
This is how the quotation chart with the DIVERGENCE KILLER indicator looks like. As you can see, the indicator finds divergences by itself, shows when to open and close deals and how much you earn on it.
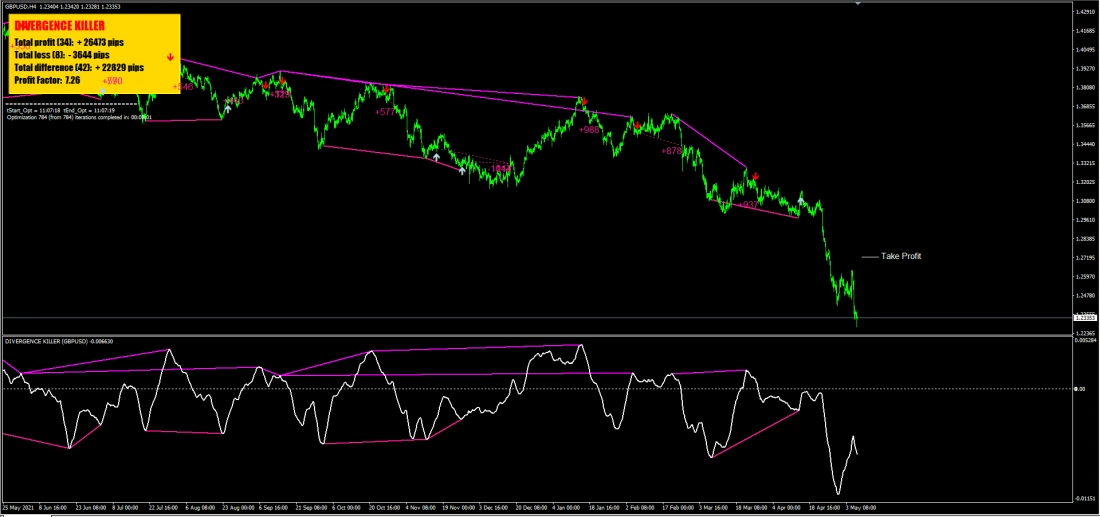
So, you see two identical charts of quotes. However, there is a classic MACD indicator on one chart and there is no clarity on how to make a profit. On another chart, the DIVERGENCE KILLER (advanced MACD indicator) and a clear understanding of how to trade and how to make a profit! Compare these two pictures and then you will understand why you need the best divergence indicator DIVERGENCE KILLER!!
Now, so that you correctly understand the principle of operation of the divergence indicator and how the divergence search occurs on the quotation chart, carefully read the information below. We assure you – if you want to make a profit on divergences/convergences (even with the help of the DIVERGENCE KILLER indicator artificial intelligence), then you need to understand exactly how it works and what divergence is!
What is divergence?
So, Forex divergence is an early sign that a turning point will soon occur on the quotation chart. That is, at first the market was moving in one direction, but there is a divergence and this tells us that the market will turn around in the near future. And such a divergence signal is usually very accurate. Specifically, about 90% of divergence/convergence signals are able to bring you profit!!
The most accurate explanation of what a divergence is in this phrase: “Divergence is when the direction of movement of the indicator diverges from the direction of price movement.” As we noted above, it is customary to use the classic MACD indicator as an indicator for tracking divergence. It was this indicator that we used to process information using artificial intelligence and created the FOREX DIVERGENCE KILLER SYSTEM.
However, divergence can also be found between the quotation chart and indicators such as stochastic oscillator or RSI, as well as other indicators that are in your trading platform. If you are a pro, then it will certainly be possible.
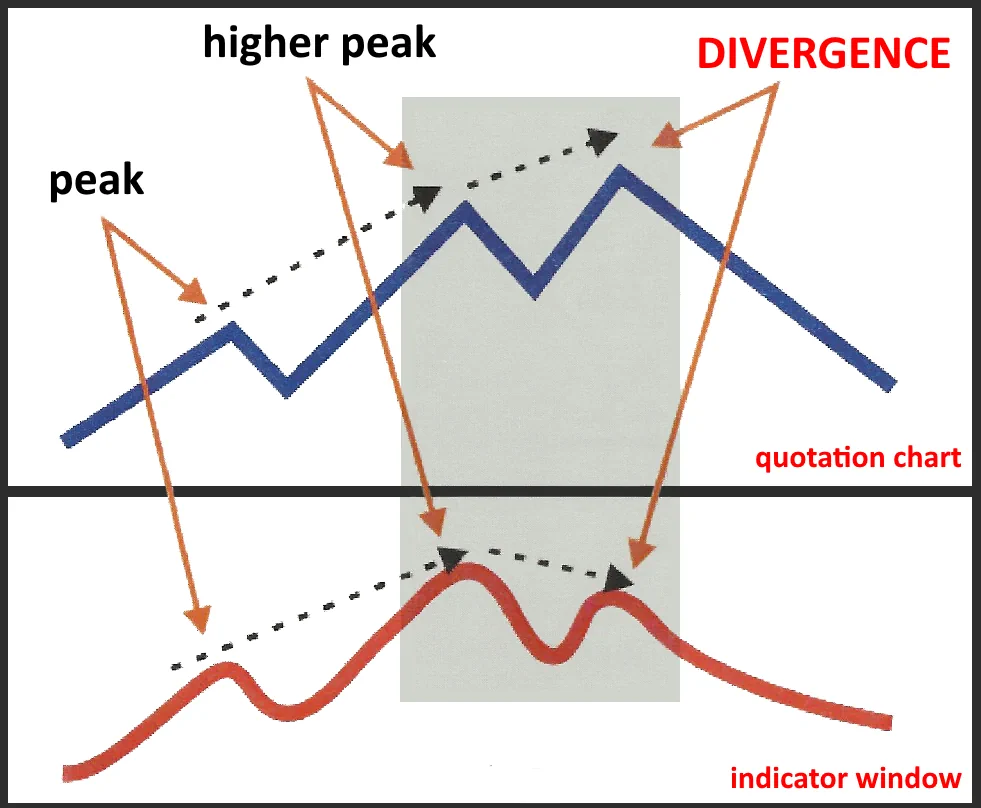
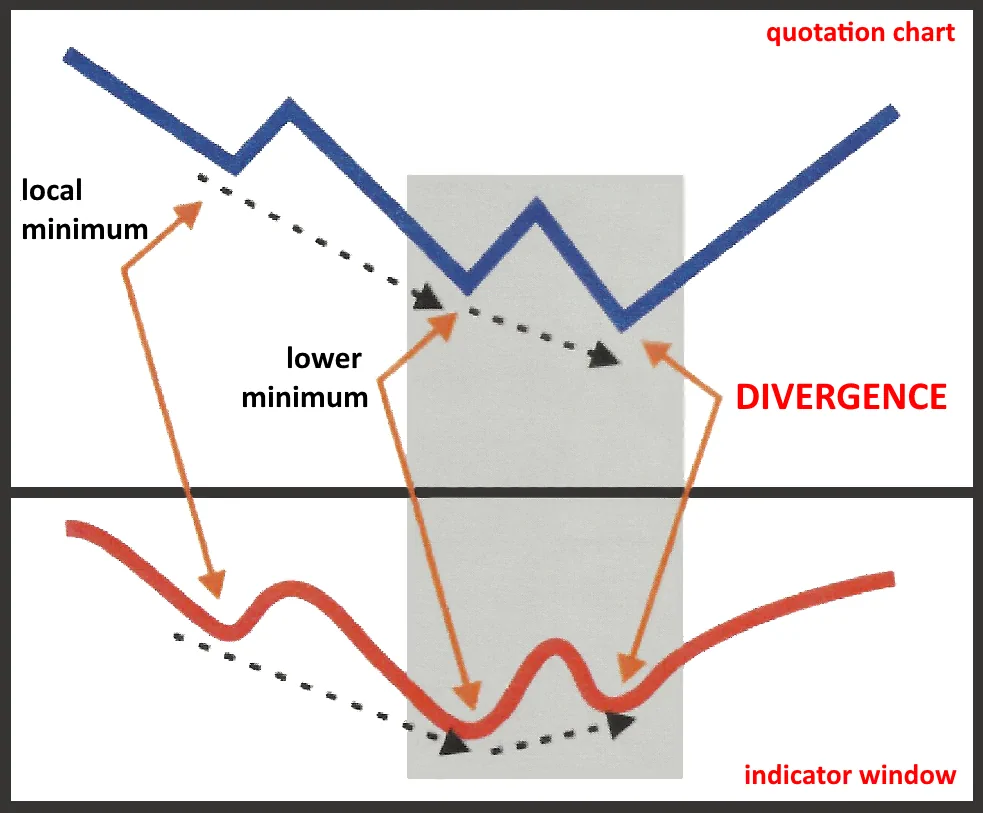
We all know that the financial market and each specific quotation chart moves in an up or down direction. At this time, any technical indicator analyzes, measures and displays market dynamics on its scale. If the quotation chart moves up, then the indicator that analyzes it also moves up. And when the quote chart draws a higher maximum, the oscillator also draws a higher maximum. Everything is logical. However, sometimes their dynamics begin to diverge and then we say that there is a divergence.
Divergence is formed when the market shows a high maximum on the chart, and the oscillator that strictly follows it does not display a higher maximum, but instead draws a lower maximum!
What does this discrepancy mean? This means that the market is weakening and there is a high probability that in the near future there will be a price correction (pullback), or a real market reversal.
Such a divergence (as we described above) is called a classical or “bearish” divergence. However, divergences do not occur only when the market is growing. A similar situation may appear when the market (quotation chart) is fall. That is, if the market shows lower lows, the indicator also displays lower lows. However, there may be discrepancies between the price chart and the dynamics of the indicator. This discrepancy (divergence) suggests that the direction of the market may change. As you understand, the divergence described above is called the classic “bullish” divergence. The term “bullish” explains the direction of movement of the price chart in which the market will move after the divergence occurs.
Now let’s summarize: “Bullish divergence”, this is if the market after the occurrence of divergence will go up. “Bearish” if the market goes down after the divergence occurs. And let’s remind you again. Divergence does not occur by itself. It appears as the difference between the movement of the quotation chart and the divergence indicator.
Types of divergences. Which ones exist?
The most common type of divergence is counter–trend divergence. Above, we described the divergence as follows: the trend moves in a certain direction, and then there is a divergence and it unfolds. Thus, if you want to make money on this, then you need to make a deal against the direction of the trend. This divergence is called – counter-trend and this style of trading is also called – counter-trend.
However, classical divergence is only one type of divergence. In fact, there are much more of them, namely:
- Classical or ordinary divergence (we talked about this above)
- Hidden divergence
- Extended divergence.
All these types of divergences can be detected by our best divergence indicator “DIVERGENCE KILLER”.
Classical divergence is the most common. It takes place during a trend reversal. Above, we described in detail what it is and how to detect it using the divergence indicator.
Hidden divergence is known to approximately 25% of traders who use conventional divergence. Hidden divergence is a sign of trend continuation. That is, if it occurs, then you can be sure that the trend will continue for some time.
Extended divergence is also a sign of trend continuation. Few people know about this kind of divergence. However, a powerful extended divergence signal will be a great signal for a new great deal with huge profitability potential!
Now consider this types of divergence listed above. How to identify them using the divergence indicator.
Classical divergence
The usual (classical, counter-trend) divergence is a signal that the trend will make a big correction or even completely reverse.
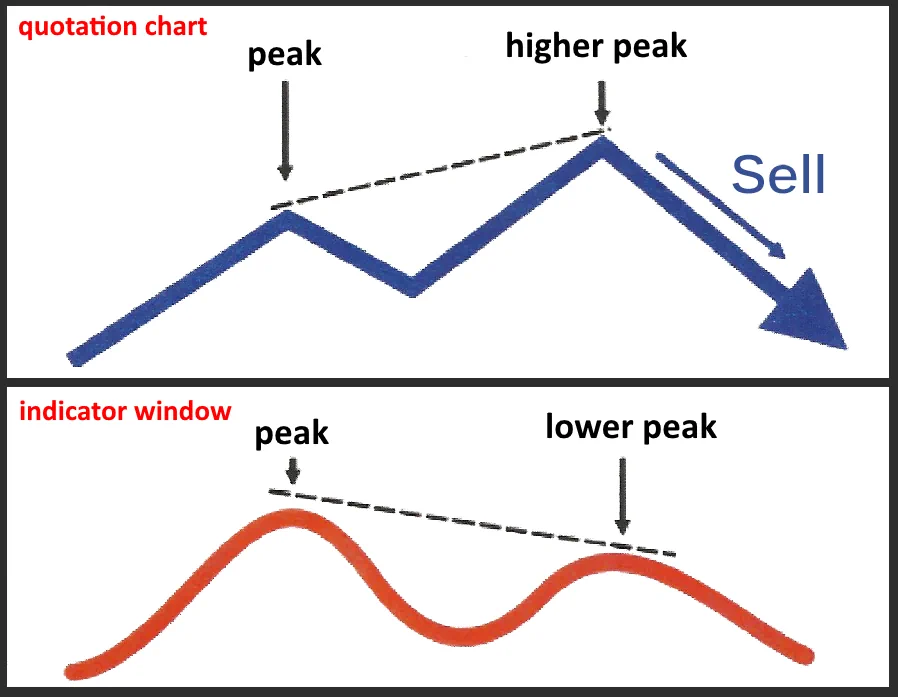
- The classic bearish divergence shows us the beginning of a reversal of the growing trend for making transactions on SELL.
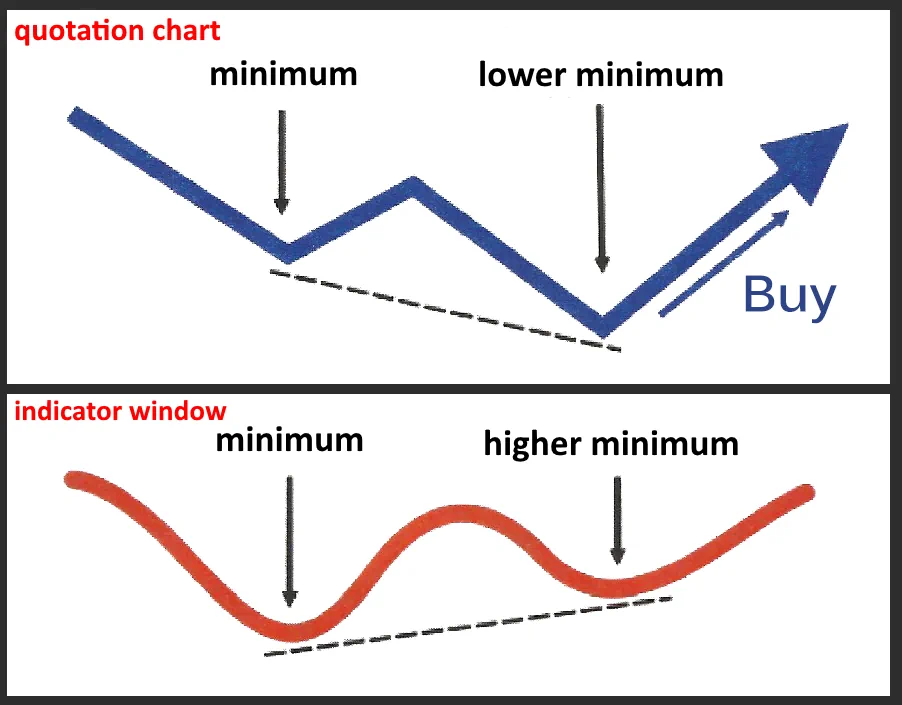
- The classic bullish divergence shows us the beginning of a reversal of the declining trend for making BUY trades.
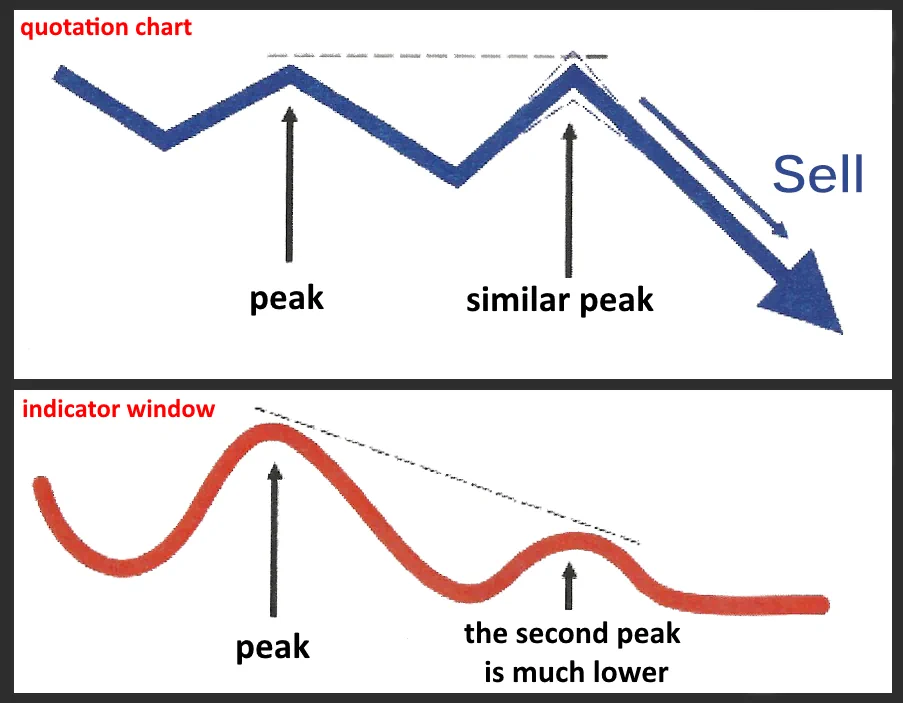
Classic bearish divergence:
To identify the classic bearish divergence, it is necessary to compare the highs of quotations and peaks on the technical indicator. Bearish divergence occurs when the price chart draws a higher maximum and the indicator draws a lower maximum. For this, it is not at all necessary that there be a series of higher highs on the price chart (in the market). It is enough to see one higher peak compared to the previous one. If the indicator shows a divergence, then this is a signal for a possible trend reversal, which we can use to open a SELL deal:
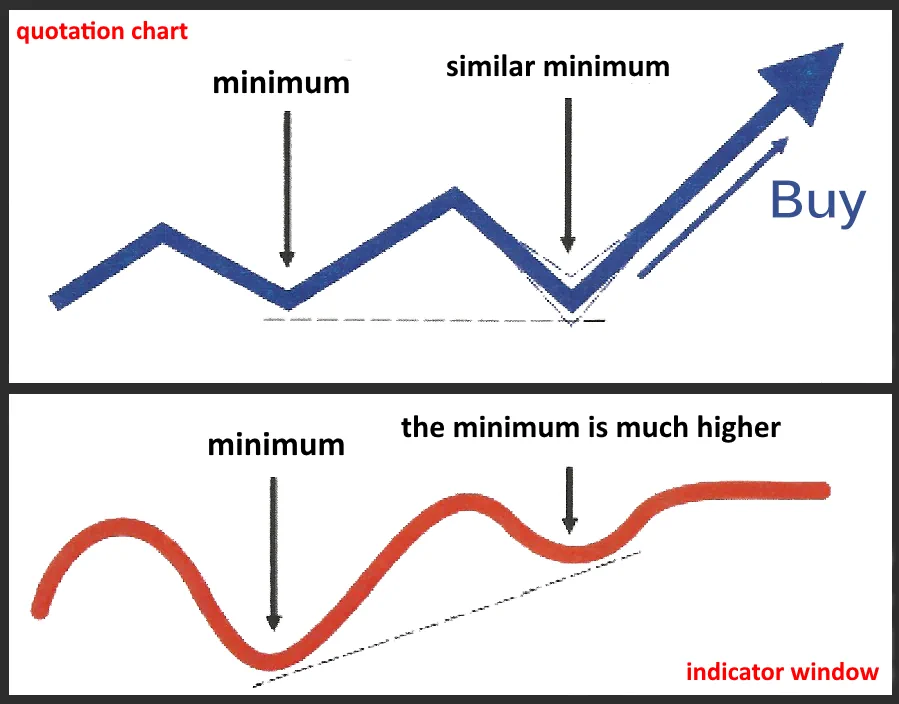
Classic bullish divergence:
To determine the classic bullish divergence on the price chart, it is necessary to look at and compare the local minima of the quotation chart and the indicator. The classic bullish divergence occurs when the price chart draws a lower minimum, and the indicator chart draws a higher minimum. It is not necessary that this is a series of lower lows on the price chart. It is enough for one lower minimum to occur compared to the previous one. If the divergence described above has occurred between the price chart and the indicator, then the price growth may soon begin and you can conclude a deal on BUY.
Please note – in all the examples shown above, we always draw a trend line between two peaks or between two peaks on the price chart and on the indicator. Such a trend line helps us visually assess and compare the direction of dynamics. If the dynamics between the price chart and the divergence indicator is different (has a different direction), then there is a divergence and we need to consider the possibility of trading. If this is a bullish divergence, it means BUY. If this is a bearish divergence, then SELL.
Hidden Divergence
As for the hidden divergence, this is a strong signal for the continuation of the trend. Few traders are able to identify it correctly. As in the previous descriptions, the hidden divergence is bearish and bullish.
The hidden bearish divergence suggests that the price chart is getting a new push to decline. The hidden bullish divergence suggests that the price growth will continue. However, let’s go into more detail.
Hidden Bearish Divergence:
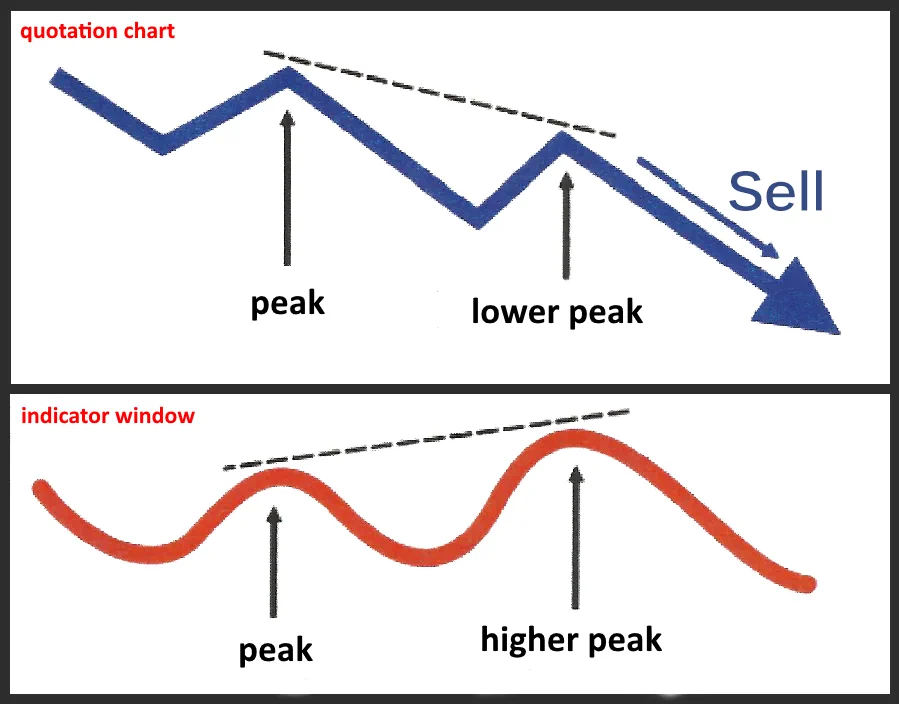
To reveal the hidden bearish divergence, it is necessary to compare the peaks of the price chart and the peaks on the divergence indicator scale. A hidden bearish divergence is identified when the asset quotes continue to move down and draw new local highs. At the same time, each new maximum is lower from the previous one. The indicator in this case shows that each new maximum is higher from the previous one. In this case, we can say that the trend will continue and the time has come for a new deal to SELL:
Hidden Bullish divergence:
In order to reveal the hidden bullish divergence, we need to look at the lows, or bottoms, of the price chart and the indicator chart. Hidden bullish divergence occurs when the price chart (market), moving up, draws higher lows. In this case, the indicator, displaying the divergence, draws a lower minimum.

As you can see, the divergence indicator is a unique tool that is able to show the reversal of the price chart and the continuation of the trend. Using our best divergence indicator, you can trade on trend and countertrend strategies and earn more than 100% profit per month. After all, we remind you that more than 90% of the signals of this indicator bring profits, which means that the size of your trading account will constantly and very quickly grow!
Extended divergence
The extended divergence is very similar to the classical divergence, however, in the extended divergence, the quotation chart always shows a double bottom or a double top. At the same time, the peaks on the double top or the lows on the double bottom are always at the same level. That is, in fact, the quotation chart makes a retest of support or resistance (which is already a strong signal for a price reversal). However, on the indicator scale we see a significant difference between the height of peaks or lows. Such an extended interpretation of market behavior suggests that the market continues to move in the same direction. That is, the quotation chart shows us a reversal, but the indicator shows a strong divergence, which says that the re-test of the level is just a consolidation of the price and soon the market will continue moving in the previous direction.
The extended bearish divergence indicates that the price chart continues to go down – it’s time to sell. The extended bullish divergence indicates that the price chart continues to go up – it’s time to buy.
Extended Bearish Divergence
In order to identify and identify the extended bearish divergence, it is necessary to compare the peaks on the quotation chart and on the indicator scale. This type of divergence occurs on strong market trends at the time of price consolidation (retests by quotes of a strong level). Usually at such a moment, traders begin to think whether there will be a rebound from the specified level or whether the quotes will break through this level and start moving towards the previous trend direction. Thus, an extended bearish divergence is an excellent signal that the trend will continue, that is, you can make a deal on SELL.
In this case, the market forms a double vertex in which the two peaks have the same height. However, at this time, the divergence indicator shows peaks of different heights:
Extended Bullish divergence
To identify an extended bullish divergence, we need to compare the dynamics between the price chart and the divergence indicator. On the price chart, we will see two lows that are equal or almost equal in height. At the same time, on the divergence indicator, we see a situation where two minima have completely different heights. This means that the consolidation of the market has ended and the trend will start moving up. Accordingly, the time has come for trading on BUY.
Divergence in the financial market is a constantly stable phenomenon that helps a trader to make the right trading decision in time and make a profit with minimal risk. As for our divergence indicator, it will help you identify the occurrence of divergence in time and correctly and choose the right trading strategy.
How much profit can you make?
We independently tested our divergence mt5 indicator. With the help of the signals of this Forex tool, we have been trading for 3 months and we earned about $61 701!!! Most importantly, this divergence indicator is very easy to use, and everyone can repeat our trading results!
Divergence Trading Indicator
- Divergence trading indicator for MT4 platform
- Divergence trading indicator for MT5 platform
- Divergence Utility for automatic order management (for MT4 and MT5)
- Set-files for automatic configuration
- Unlimited license (for any number of accounts that belong to you)
- Detailed instructions – how to install and use